Republished from ThumbtackInvestor's blog with permission. The article below is an excerpt of a long piece on Dutech Holdings which you are encouraged to read at the blog of ThumbtackInvestor, a Singaporean in his mid-30s, whose portfolio is valued at just over S$1 million.
| Price vs intrinsic value No matter how great the company is, there’s always a price range, past which the investment no longer makes sense. So let me try to relate the price to my perceived value here. For my calculations, I’ll assume the share price is $0.445 cos that’s the current price. (And that’s the price my most recent accumulation is at) Based on FY15’s core earnings (excluding one off, extraordinary gains) of 31.3 RMB cents, the PER is currently 6.8 times. That is misleading though, as FY16’s earnings is likely to exceed FY15 very substantially. Earnings at the 9M mark is already 10% higher than the corresponding period in FY15 and as I’ll show in Part II of this discussion, Dutech’s 4Q16 results are likely going to be a blowout quarter, such that FY16 performance would be >>> that of FY15. |
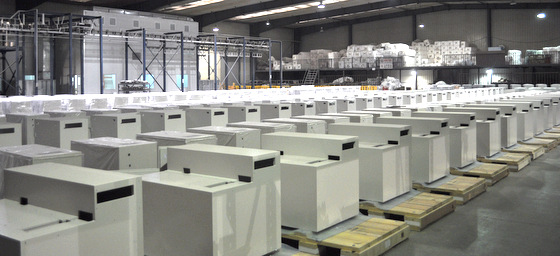 ATM safes @ Dutech's factory in Nantong which is about 100 km from Shanghai. NextInsight file photo
As of mrq (most recent quarter), Dutech’s book value is RMB 223.19 cents, which works out to a P/B ratio of 0.96.
All these valuation metrics by themselves, are not very useful. We need to compare to industry peers to have an idea of what’s the norm.
In this space, Dutech doesn’t really have any peers to compare against. I don’t consider the myriad number of local safe manufacturers in China as Dutech’s peers.
The closest is Stockholm-listed Gunnebo Group, which manufactures safes as well as cash management systems, although they have other dissimilar segments such as entrance security.
For FY15, Gunnebo’s EPS = 2.18 SEK, with a BV of 22.65 SEK. ROE figures work out to be 9.9%.
As of 9M2016, Gunnebo’s EPS = 1.35 SEK, with a BV of 22.42 SEK. ROE = 11.1%
Based on the share price of 39.60 SEK, this works out a PER of 18.2, and a P/B of 1.77 times.
In comparison, Dutech’s PER of 6.8 times and P/B of 0.96 look comparatively cheap.
| Gunnebo Group | Dutech Holdings | |
| PE | 18.2 | 6.8 |
| P/B | 1.77 | 0.96 |
Here are the related FS for Gunnebo:
gunnebo-third-quarter-report-2016
gunnebo-annual-report-2015
Despite the massive run up in Dutech’s share price in 2016, it is still some way away from matching the valuation of peers.
On top of that, Dutech is in a growth phase. CFs are growing y-o-y, whereas Gunnebo is a mature company, and growth was stymied in 2016. Dutech is also generating much higher rates of return on its equity compared to Gunnebo.
My personal favorite valuation technique though, is the discounted cash flow modelling. The concept behind DCF makes perfect sense to me. As with all modelling techniques, though, the input parameters are the key.
And since we’ll have to rely on a bunch of assumptions, we can’t expect the CFs to be iron clad. Still, I find it to be a great tool to get some idea of valuation. Sides, one can monitor the CFs and update the DCF model quarterly to see how it’s progressing and tweak it accordingly.
CIMB has worked out a DCF model in one of their reports. I really wished they’d give more details though, it took me a long time to figure out the numbers. Even now, I still don’t get why they have such high CF figures past FY18: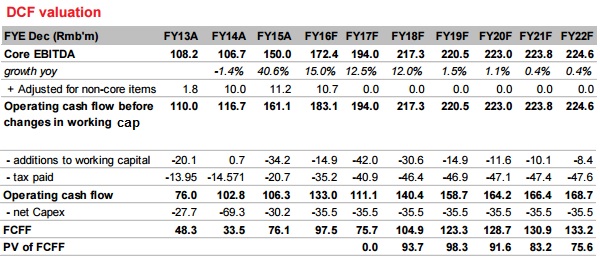
I get that they’re probably expecting a significant dip in FY17 CFs due to consolidation expenses from the recent acquisition of Metric. I thought it’s a bit too aggressive a drop.
But following FY17, they’re expecting a massive jump in CFs from FY18 onwards, particularly from FY18 to FY19, with a massive 17% jump. Don’t quite get how they came up with this. 
Interestingly, I used my own DCF modelling, with somewhat different figures and assumptions, and it didn’t come out to be too far from CIMB’s TP either.
TTI’S DCF:
| DISCOUNTED CASH FLOW VALUATION MODEL | |
| Future Value (FV) = Discounted Present Value (DPV) X (1+i)n where i = interest rate (Cost of tying up capital) and n = number of years | |
| OR DPV = FV (1 - d)n, where d = discount rate | |
| FCF: Operating cashflow - CapEx | |
| Market Cap: 356,536,000 shares at $0.46 each = $164,006,560 | |
| Year | Year | CF | DF | DR | DCF | NPV |
| 0 | ||||||
| 1 | 2017 | 85,000 | 1.120 | 12.00% | 75,892.86 | 1,022,616.05 |
| 2 | 2018 | 91,800 | 1.254 | 73,182.40 | ||
| 3 | 2019 | 99,144 | 1.405 | 70,568.74 | ||
| 4 | 2020 | 107,076 | 1.574 | 68,048.73 | ||
| 5 | 2021 | 115,642 | 1.762 | 65,618.38 | ||
| 6 | 2022 | 1,179,544 | 1.762 | 12.00% | 669,304.94 |
I started out being more aggressive than CIMB, by expecting that CFs are not that greatly impacted in FY17.
I also assumed that the WACC is 12%, and that the CF growth rate in the 1st 5 years is 8%. Long term growth rate is 2%. (Much more conservative than CIMB’s massive jump)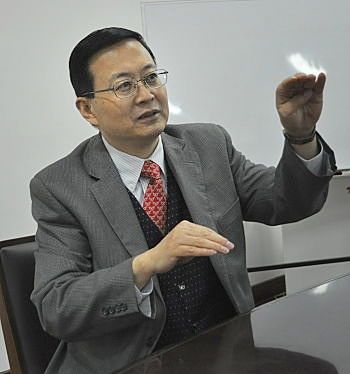 Dr Johnny Liu, CEO of Dutech Holdings. NextInsight file photo Using the Gordon Growth Model, the Terminal Value I got is RMB 1,179,544,000
Adding all that up gives us an Enterprise Value of RMB 1,022,616,000
Net cash and cash equivalents as of FY16Q3 = RMB 222,426,000
Fair Value = RMB 1,245,042,000
Equity value / share = 0.72 SGD
Illiquidity discount = 15% (CIMB used 20%. 20%-30% is typically used for private, illiquid companies, but since Dutech is listed and not that illiquid, I opted for 15%)
TTI’s DCF Target Price = 0.612 SGD
Which is not too far from CIMB’s 0.65 SGD TP.
I’ll leave point 4, which analyzes Dutech’s scalability and prospects going forward, to Part II as it is really long.
Please share your thoughts and comments with me in the comments section, or via email, especially if you’re familiar with Dutech’s operations.