Republished from ThumbTackInvestor with permission. The investor's portfolio is valued at close to S$1 million.
In my earlier post, I mentioned that I agree largely with Alain T’s investing thesis, yet I personally do not own a stake in Si2i, and if I ever do, it’ll be a very small allocation. Why the contradiction? Why agree with a positive investing thesis, yet not feel confident enough to allocate capital to the idea?
I feel I need to justify my comments. Firstly, the investing thesis was written by Alain in the early part of June (I think), or before. With the benefit of hindsight, if you had invested in the company then, the share price has done this:
On top of that, at the end of June, the company did a 1-off capital reduction exercise and returned a cool $ 0.729/share. So if one took up a position then, the returns now would’ve been a real pretty sight. I won’t even do the math here, but if you’d just add ($0.729 + capital gains of about $0.1) / intial vested price of around $1.65, and then annualize the return…. the ROI figure should be eye popping.
But if this was a “buy and hold” kinda investment, and you got in a few yrs ago, well, that’s just too bad:
The company did a 400 to 1 share consolidation on the 30th June 2015. Yes, 400 to 1!
If you were one of those who had 400 shares converted to 1, it’s almost impossible to recover from that.
What I am trying to say is that the timing of investing, in this case, makes a world of difference.
Yet, all this is with the benefit of hindsight. The most important question is how the future of the company looks like. And herein lies the reason why, after eating/drinking/thinking/dreaming Si2i the past week, I am reluctant to take up a sizable position.
IMO, it’s absolutely terrible to buy shares in Si2i before June 2015, it’s absolutely great to buy shares between June 2015 and June 2016, and buying shares now, in Oct 2016, is somewhere in between terrible and great.
Let me try to explain myself. I will add a disclaimer here: Si2i’s business is in a field that I have absolutely minimal knowledge in. In fact, I am pretty much an IT idiot in real life. No kidding. I have no Facebook, no Twitter, no Instagram, none of the stuff that the whole world seems to need.
While it’s not difficult to understand the main business of Si2i (distribution of prepaid phone cards in Indonesia), the other 2 arms confuse me totally. I mean, I can read the words in the description, yet… I still don’t quite understand how it really works. From start to end. From the initial contact with clients, how the services are carried out, revenue is recorded and recognised and collected, what are the costs needed to achieve this revenue etc.
Ok, so for an absolute IT idiot, what exactly does the description mean?
This alone, makes me highly reluctant to invest. I mean, I know what’s “hardware infrastructure”, but… what exactly is that?! “Service integration business”. BLAH. English please.
So let me recap: The main idea in the investing thesis is that this is a company that’s currently on the SGX watch list. It was churning up massive losses for several years, but has since turned around and in the last 4 quarters (FY15Q3, Q4, FY16Q1, Q2) has been profitable.
To exit the watch list, the company would’ve to fulfill 2 criteria by March 2018:
- Be profitable in the last financial year
- Maintain a market cap of a 6-month average of at least $40mil
The company is already profitable for the last 4 quarters, and will likely remain profitable for 2016. The market cap of $40mil works out to be about $2.92/share, and the author used this figure to determine the potential upside if the company manages to exit the watch list.
I really liked how Alain considered the possibility of NOT exiting the watch list and being forced to delist. I went through that portion with a fine comb and it was obviously very detailed, can’t disagree with any part of that.
So what really caught my attention for this thesis, is that it has a real tangible, hard catalyst. The need to exit the watchlist is the catalyst. If the management achieves that, the upside is huge from here.
Alain has shown that even if management fails to do so, the potential exit offer (not compulsory but “highly encouraged”) would be substantially higher than the current share price.
My reluctance in investing though, stems from the fact that my personal analysis indicates that there is a real possibility, and in fact, currently it is not just possible but probable, that the company actually fails to meet the targets and gets delisted.
Although the author has shown how an exit offer would still be profitable, in my limited experience with exit offers, it’s really unpredictable. I prefer to have hard figures backing me up, not rely on a potential exit offer 1.5 years from now.
To put it another way, if in my analysis, I believed the company has a high likelihood of exiting the watch list by achieving the above-mentioned 2 points, I’d not only take a stake, my position sizing would be moderate to perhaps even a core.
So the next logical question is, why do I think the company is more likely to fail to meet the 2 criteria mentioned above?
Let me explain.
- Show a profit before tax in a single financial year.
Let me start with this simple equation:
INPUT – OUTPUT = PROFIT FOR SHAREHOLDERS
Input = Revenue
Output = Cost of goods sold, all sorts of expenses, taxes etc.
So to turn around the company and have profit become positive, we need Input > Output right?
So for a turnaround story, the management either has to:
- Increase “Input”
- Decrease “Output”
- Increase “Input” + Decrease “Output”
The best way to turn around the company is obviously by 3. Followed by 1. And finally, by 2. This is because increasing “input” is kinda like being long: the upside is unlimited. Decreasing “output” is kinda like being short: what you can possibly achieve is limited, and in fact, in this instance, the company can’t possibly have 0 expenses so the limit is even closer.
So to understand how the company’s profitability is improved, I went into detail to find out which scenario it is, and in this case, it’s obviously 2.
In all my earlier analysis, I always compiled full year data. This is because for long term, deep value investors, it makes more sense to figure out the big data first. It’s kinda like if you wanna know if Messi is a good player, you’ve gotta look at his career statistics. Stuff like how many goals he’s scored per minute of game time he’s played, how many assists, what’s his average sprint speed, how much % of accurate passes etc.
It makes no sense to look at data from a single game or even a single season and try to determine if he’s a good player. He could’ve had an off day, as we all do. He could’ve been nursing a cold for that game. He could’ve worn a new pair of boots etc.
BUT in this analysis, I did the reverse: I placed emphasis on quarterly data rather than full year. This is because I am tracking a turnaround story. I wanna investigate the fine details of what’s happening, if I have monthly data, I’d use that instead of quarterly ones.
It’s kinda like if a patient did a major surgery, the surgeon would want to track closely the healing process. The reviews could be daily, or even hourly, to assess every step of the healing process, making sure there’s no infection, wound hygiene is good, no post operative complications etc. If the patient is in for a normal health check up though, that can be done annually. The clinician only needs to look at a snap shot in time annually, not a series of data sets in close proximity to each other.
OK I’m digressing. Let’s get back.
Here’s a table I’ve compiled showing Si2i’s revenue/turnover in recent quarters:
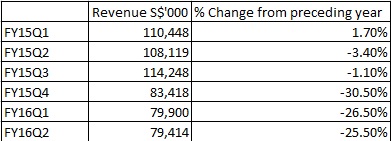
As we can see, starting from FY15Q4, the revenue dropped substantially and in the past 3 quarters, the drop is between 25%-30% from the preceding year, although the drop has decreased. (Decreasing y-o-y at a decreasing rate)
Looking at compiled data like this is very useful, as we can conclude that FY16 full year would likely show a drop in revenue of something like 24%-27%.
As mentioned in the earlier investing thesis, the drop is because of the consolidation in clusters by the client, resulting in Si2i having less clusters (to sell prepaid cards)
The company also breaks down the revenue, so let’s take a look at the breakdown for the mrq:

The “distribution of operator products and services” is the main arm for Si2i, and there’s a 27% decrease y-o-y for 1H2016, pretty much in line with the above data.
The “ICT distribution and managed services” remained fairly flat. Can’t comment much on this since it’s the technical jargon stuff.
The “Mobile devices distribution and retail” relates to their Nexian brand of handphones. I’d conservatively write off the revenue from this segment totally in my longer term calculations, as the company is in the midst of closing physical stores and switching to an online model.
Thus far, we know that Si2i’s revenue has dropped about 27% or so every quarter. How does its profitability look like?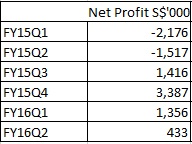
That’s interesting… the company’s net profit increased and turned positive for the 1st time in a long while in FY15Q3, at a time when revenue dropped about 27% or so.
How did the company become profitable from loss making, when the revenue has dropped rather significantly?
Answer: By cutting expenses at a rate that’s greater than the drop in revenue.
I’ve compiled a table of the quarterly “Output” here:
|
(SGD) |
1Q15 |
2Q15 |
3Q15 |
4Q15 |
1Q16 |
2Q16 |
|
Turnover |
115,610 |
108,119 |
114,248 |
83,418 |
79,900 |
79,414 |
|
Change in Turnover from preceding quarter |
|
-6.48% |
5.67% |
-26.99% |
-4.22% |
-0.61% |
|
Purchases and changes in inventories and direct service fees incurred |
-102,697 |
-100,503 |
-106,130 |
-77,578 |
-73,867 |
-72,824 |
|
Commissions and other selling expenses |
-133 |
-85 |
-23 |
-42 |
-39 |
-124 |
|
Other income - operating |
463 |
896 |
406 |
957 |
490 |
652 |
|
Operating expenses |
-9,772 |
-9,706 |
-7,437 |
-5,808 |
-5,817 |
-6,359 |
|
Other income - non-operating |
-14 |
- |
- |
3,611 |
876 |
- |
|
Other expenses - non-operating |
- |
162 |
964 |
-1,322 |
461 |
30 |
|
Interest income from deposits and investment securities |
124 |
132 |
41 |
294 |
199 |
162 |
|
Finance costs |
-135 |
-224 |
-258 |
-96 |
-80 |
-77 |
|
Depreciation of property, plant and equipment |
-370 |
-388 |
-330 |
-348 |
-212 |
-239 |
|
Amortisation of intangible assets |
-37 |
-26 |
-23 |
-99 |
-16 |
-15 |
|
Total of "Output" |
-112,571 |
-109,742 |
-112,790 |
-80,431 |
-78,005 |
-78,794 |
|
Change in "Output" from preceding quarter |
|
-2.51% |
2.78% |
-28.69% |
-3.02% |
1.01% |
|
Profit / (Loss) before |
||||||
|
From continuing operations |
- |
- |
- |
2,987 |
1,895 |
620 |
|
From discontinued operations |
- |
- |
- |
-39 |
- |
- |
|
Total Profit / (Loss) before taxation |
-2,123 |
-1,623 |
1,458 |
2,948 |
1,895 |
620 |
Now it becomes a lot easier to track quarterly figures and observe the trend. Let’s try to make some sense of this.
As we can clearly see, the turnover (“Input”) has dropped every quarter, except for 3Q15.
In 3Q15, the turnover actually increased 5.67% from the preceding quarter, but “Output” actually increased only 2.78%. No wonder the quarter became +ve for the 1st time. Remember the equation above:
Input – Output = Profits
Subsequently, in 4Q15, turnover dropped 26.99%, but “Output” dropped even more at 28.69%.
Herein lies the substantiation for my statement above: The company became profitable despite the drop in revenue, by cutting expenses more aggressively.
What is a worry though, is the mrq (2Q16). From the data, we derive 2 conclusions:
- The turnover dipped slightly by 0.61%, but the “Output” actually increased (not drop!) by 1.01%.
- Both the % changes for turnover and total “output” has decreased and leveled off.
Is this a sign that in subsequent quarters, the amount/leeway to cut “output” is limited? Or is this just a temporary blip in the cost cutting and elimination of non profitable arms?
Bearing in mind that this is just a single quarter, we’ll need more data in further quarters to answer that question.
To sidetrack a bit, the next quarter results may be misleading as the company has recently divested 3 Indonesian properties that are non core. The divestment, taken in its totality, had a net positive effect on the NAV and profitability. Hence, this one-off, extraordinary item has to be eliminated to have a true assessment of the finances of the company next quarter.
IMO, the row to track so as to get a quick and simple idea of how the company is lowering expenses, is the “Operating expenses” (highlighted in green)
Again, the data corroborates with my statements thus far. Broadly speaking, we see a lowering of operating expenses over the quarters. In my personal analysis, I went further back to much earlier quarters (not shown in this table), and the operating expenses were even higher, reaching $12mil or so in many instances.
And again, we can observe the uptick in operating expenses in the mrq.
(BTW I assumed readers understood the abbreviations since Yahoo! uses it as well, but if you didn’t, mrq = “most recent quarter”)
My conclusion here, is that although the company did well swinging back to profitability, practically all of it is done by taking a chainsaw to operating expenses. There’s a diminishing effect to doing so, as the expenses drop. Afterall, there’s no way it can ever reach 0 as long as there’s turnover.
And although I think the company will stay profitable for 2016 and 2017, hence fulfilling the 1st criteria to get off the watch list, the profits will likely stagnate and level off in 2017 onwards, unless the company can find some new revenue streams aside from distributing prepaid phone cards (and that provision of hardware infrastructure stuff that I don’t understand)
The management probably knows what I know too.
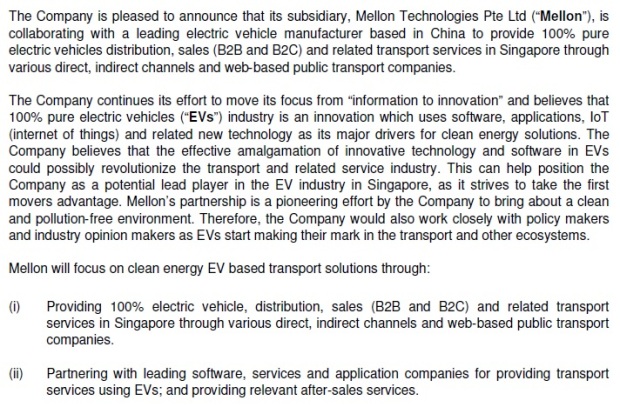
Which is why, they have expanded into a new field: Electric Vehicles (EV).
This was not mentioned in the earlier report by my friend Alain, as this development is fairly recent. In Sept 2016, the company acquired 15 electric cars and charging stations from BYD (of Warrren Buffett fame) for a total consideration of $1,123,500.
Now, if you’re thinking, $1,123,500 for 15 electric cars and stations doesn’t sound like a lot, it’s just a tiny venture, probably to test things out, that’s what I thought too. In fact, I was thinking wow I didn’t know it’s so cheap initially. It works out to be about $75k for each car.
But after digging further, I found that to get each of these BYD e6 cars operational, one has to include the taxes and COE, and that results in each car costing about $200k, substantially more than the $75k mentioned in the statement release.
On top of that, more costs have to be sunk to set up the infrastructure, do marketing etc, so I’ll expect the capital that has to be committed, will be much greater than $3mil ($200k x 15)
The company intends to utilize the EVs as a commercial fleet for transportation, and has set up a subsidiary called “S Dreams”, utilizing the ride hailing services of Uber.
I am rather skeptical of this new venture. It sure sounds and looks sexy, but if I break it down logically, I cannot see any competitive advantages that S Dreams has, over conventional petrol-fueled transport services like Grab or Uber.
I think the company is smart to link up with Uber, as this saves a lot of start up costs, and helps them to avoid the pitfalls of entering a new venture on their own. But if I am going to hail a ride, I wouldn’t necessary choose an EV, would I? Would you?
The only touted “benefit” is that the EVs would offer free Wifi. Not really a deal maker or breaker IMO.
Alright, so in the long run, they may expand to providing transport to businesses and not just to consumers. Possibly distributorship of EVs. Perhaps maintenance and repair of EVs too.
All nice and sexy, but like I said above, in real life, I am a low tech guy who loves unsexy stories. No fancy jargon, no clutter, no stuff that doesn’t serve a purpose. (Entertainment is considered a purpose)
So all I am interested in is, how much $$$ can this make the company, and by extension, me if I am a shareholder. I simply see no real competitive advantage here. My worry is that the company tries too hard to move “towards a strategy of ‘Information’ to ‘Innovation’.”
The words in italics are the company’s own words.
The problem here is that I don’t really want “Innovation”. I want profits, I want FCF, I want a rising share price. If you can get that by planting bean plants and that beats EVs, I much prefer the bean plants please. When I eventually become a billionaire (hopefully possibly), and have nothing to do with my life (unlikely), maybe I’d want innovation then.
 What puzzles me is that if management is trying to achieve that sort of ROI and hit the required market cap, why distribute $0.729 to shareholders? What puzzles me is that if management is trying to achieve that sort of ROI and hit the required market cap, why distribute $0.729 to shareholders?Won’t keeping the cash, which works out to be $10mil, a quarter of the market cap that’s needed, make it so much easier to reach that goal? As it stands, currently, the management has to create value at an amazing rate for the next 18mths to exit the watchlist. A 67% rise from here…. I don’t think anyone would disagree with me when I describe it as “herculean”. |
So my point here is that, it remains to be seen what happens of this new venture. Management could prove me wrong by conquering the transport market here. But right now, based on what I’ve found and my understanding of the data, I’m prescribing a value of 0 to this new venture. In fact, it’s a slight negative IMO because the management has had a terrible record with new ventures.
Let me move on to the 2nd point to exit the watch list:
2. Achieve an average 6-month market cap of $40mil
Market cap of $40mil works out to be a share price of $2.92 if the current number of shares remain the same. Considering the share price is $1.75 now, that means the share price has to rise about 67% between now and March 2018, and stay approximately there for 6mths minimum.
That’s a 67% ROI in approximately 18mths, or an approximate annualised ROI of 45%.
That’s a herculean task.
Let me recap what I’ve shown thus far.
I have shown how the profitability is due to cutting of expenses, not growing the topline. Hence, there is some doubt in my mind as to whether profits can grow much more from here.
I have also shown that just based on statistics, it’s not likely to reach the required market cap.
Thus the next logical thing is to work on the premise of a forced delisting. Alain has shown how it can still be highly profitable for existing shareholders. The work is amazing, I’d be proud if I did that. And in all likelihood, that may very well be the scenario that pans out.
Well, I wouldn’t use the maximum end of the range when calculating possible ROI just based on the likely delisting offer price, as like I said above, in my experience, delisting offers are really touch and go.
The owners taking the company private are not going to be thinking of the little guy. The offer price is not more generous than what he can get away with. So stuff like the market conditions at that point in time, the financial position of the company, the media coverage and attention it gets all come into play.
None of these are stuff that anyone can evaluate currently.
|
CONCLUSIONS As I stated earlier, the turnaround story is alive and kicking, but I have my doubts regarding the rate/pace of it in the coming quarters. Unless management has a new trick in their play book, other than just simply cutting costs. (Stuff like expanding into related businesses, acquiring related businesses, expanding current businesses organically by winning more clusters etc) |
